
Air Temp Compensation table
 Dec 8, 2008, 01:35 PM
#61
Do you know if there's any way to manipulate the scaling so that the furthest left number (now 0.53) would represent something like 120*F and the furthest right number (now 1.28) would represent something like 20*F?
-40 to 180 is too wide of a spread for only 4 columns... 55 degrees per column is pretty low res. Both my two temp points really still fall in one column.
I understand if this is not possible.
-40 to 180 is too wide of a spread for only 4 columns... 55 degrees per column is pretty low res. Both my two temp points really still fall in one column.
I understand if this is not possible.
Last edited by honki24; Dec 9, 2008 at 09:40 AM.
 Dec 11, 2008, 06:12 AM
#64
Dec 11, 2008, 08:12 AM
#65
You probably don't want to rescale because I think those values also help the car to deal with elevation changes. You may never see the temepratures that it would convert to at your local pressure, and if your area is flat you might be fine. But take a drive with large changes in altitude and you may have issues if you rescale.
Dec 12, 2008, 05:58 AM
#66
Evolving Member

Join Date: Jun 2005
Location: McKinney TX
Posts: 259
Likes: 0
Received 0 Likes
on
0 Posts
may not be meaningless, that range of values is suspiciously similar to an air density table in g/L from 0C/sea level to 100C/10000ft, or possibly a volume correction factor or specific volume chart.
Last edited by GrocMax; Dec 12, 2008 at 06:04 AM.
Dec 12, 2008, 12:05 PM
#67
The only thing that stopped me believing this was the only temp control map when testing early this year was that the numbers in it do not reflect the values you normally see when tuning a motor from scratch. Someone will need to disassemble it completely to see what goes on. I have a feeling may correlate its correction based on multiple maps. There are 2 other maps not posted yet in the same subroutine as the 3D map. I am not entirely sure they are Air Temp, and I dont really know the scale address so I just based it off the ignition trim maps.
<table name="MAF Air Temp #1" category="Fuel" address="33a2" type="2D" level="2" scaling="EnrichmentAdj">
<table name="X" address="67a2" type="X Axis" elements="8" scaling="Temp"/>
</table>
<table name="MAF Air Temp #2" category="Fuel" address="33aa" type="2D" level="2" scaling="EnrichmentAdj">
<table name="X" address="67a2" type="X Axis" elements="8" scaling="Temp"/>
</table>
This map is closer to what I would expect to see for temperature based fuel trims, where the AFR is richer above ~20C and leaner below 20C. This aligns with the idea that a cooler air charage is less likely to detonate.
Any idea of what the two conditions are that control these maps?
Dec 12, 2008, 01:29 PM
#68
Evolved Member

Join Date: Apr 2008
Location: Sydney, Australia
Posts: 604
Likes: 0
Received 0 Likes
on
0 Posts
It works the other way around. Hot temps require the fuel to be trimmed down, and vice versa. In these maps, one map is a flat number, and the other map reflects an inversed view of the map I posted on Page 1.
At this point I still stand by changing the map from the first page. It is the only map that has data that matches real world tuning if a little aggressive, and changing the map for a given air temp definitely changes the fuelling. I dont think it is purely there for density conversion.... you will notice the last two numbers on the right of the table are the same. If this was for scientific density conversion there would be no numbers on this map the same.
Do you know something!!! Looking just now at both maps... maybe the inverted one is the trim map based off the the other. If you mulitply numbers from both maps for a given air temp together you get a result that is VERY close to what we see when mapping fuel vs air temp for aftermarket systems from scratch. Worth looking at.
Mulitplying them together you get values of 1.11, 1.06, 1.03, 1.00, 0.97, 0.95, 0.91, 0.91
Might be worth experimenting with...
Dec 12, 2008, 02:07 PM
#69
Yep, I think we are on the same page with the idea that these multiply together.
I was thinking the density compensation was just to make the load/airflow numbers match the ideal gas laws, then these other tables come in to scale things back to what you would want the fueling to actually be. I imagine this is done to keep the background 'calculations' seperate from the 'tuning' when they are doing the factory mapping.
EDIT:
Any chance the table that is basically zero'd out being a table that is used during the warmup routine?
Last edited by 03whitegsr; Dec 12, 2008 at 02:15 PM.
Dec 12, 2008, 03:45 PM
#70
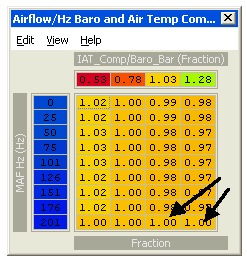
It looks like colume 2 is what they would have considered the standard conditions. Anything outside of the standard conditions may need a correction applied to help deal with non-linearities of the MAF sensor. If the table is assumed to be specific volume, then as air density increases, the ECU is increasing the air metered signal based on that table. 0.53 would correspond to the maximum air density (roughly 8,000' below sea level and -40C) with the 1.28 being something like a spring day at 10,000'. The range seems a little funny to me though.
I don't think I would use this table for any WOT correction though, considering the current scaling points towards this map only being for light loads. The combinations of maps posted by Matjin seem to be what mitsubishi intended to be used for IAT trims. But futher dissassembly would verify that.
Last edited by 03whitegsr; Dec 12, 2008 at 04:23 PM.
Dec 12, 2008, 10:35 PM
#72
Evolved Member
Join Date: Apr 2008
Location: Sydney, Australia
Posts: 604
Likes: 0
Received 0 Likes
on
0 Posts
On a little side note, I saw in the workshop manual the measurement conditions for baro. It says that 4.5V = 114kpa and 0.2V = 5kpa. Could be useful in getting scale calculations working accurately.
I might have a play with the flat map and the inverted map to see what effects it has. Just at the moment the car is running perfectly and I have no incentive to go and mess with things :-)
I might have a play with the flat map and the inverted map to see what effects it has. Just at the moment the car is running perfectly and I have no incentive to go and mess with things :-)