
How-to: Rescale Load Axis (percent) Values in Evo VIII ECU
 Jul 11, 2006, 02:56 PM
#1
Evolved Member
Thread Starter
iTrader: (17)

Join Date: Apr 2004
Location: 41� 59' N, 87� 54' W
Posts: 6,224
Likes: 0
Received 0 Likes
on
0 Posts
Alright, let's see if I can get all of these posts up before somebody hops in... Text first, pics later. 
Big thanks to Razorlab for hosting the PDF of this tutorial!
===============
Introduction
This tutorial will demonstrate how to edit the Timing and Fuel maps from a stock Evolution VIII to accommodate a Load (%) range from 0 to 300 instead of the default range of 0 to 260, using ECUflash (www.openecu.org). It is assumed that the reader is familiar with the basic functionality of ECUflash.
Why does the Load (%) range need to be modified?
Some modified Evolution VIIIs can exceed the maximum calculated Load percentage of 260. Running a bigger turbo, increasing the engine volumetric efficiency (VE) with cams or intake modifications, or running high boost all can lead to situations where the Load (%) value calculated by the ECU exceeds the stock maps� maximum value of 260.
In order to allow the ECU to control timing and fuel values over a wider Load (%) range, additional columns have to be defined for the table. Unfortunately the Evolution VIII ECU is limited to its existing number of columns, which are:
...
Big thanks to Razorlab for hosting the PDF of this tutorial!
===============
Introduction
This tutorial will demonstrate how to edit the Timing and Fuel maps from a stock Evolution VIII to accommodate a Load (%) range from 0 to 300 instead of the default range of 0 to 260, using ECUflash (www.openecu.org). It is assumed that the reader is familiar with the basic functionality of ECUflash.
Why does the Load (%) range need to be modified?
Some modified Evolution VIIIs can exceed the maximum calculated Load percentage of 260. Running a bigger turbo, increasing the engine volumetric efficiency (VE) with cams or intake modifications, or running high boost all can lead to situations where the Load (%) value calculated by the ECU exceeds the stock maps� maximum value of 260.
In order to allow the ECU to control timing and fuel values over a wider Load (%) range, additional columns have to be defined for the table. Unfortunately the Evolution VIII ECU is limited to its existing number of columns, which are:
- Timing tables: [0,10,20,30,40,50,60,70,80,90,100,120,140,160,180,2 00,220,240,260].
- Fuel tables: [10,20,30,40,50,60,70,80,90,100,120,140,160,180,200 ,220,240,260].
...
Last edited by Ludikraut; Jul 12, 2006 at 02:50 PM.
 Jul 11, 2006, 02:57 PM
#2
Evolved Member
Thread Starter
iTrader: (17)
Join Date: Apr 2004
Location: 41� 59' N, 87� 54' W
Posts: 6,224
Likes: 0
Received 0 Likes
on
0 Posts
1.) Open the ECU ROM file and pull up the High Octane Ignition Map.
Figure 1 shows what the stock* High Octane Ignition Map looks like. Cars that have already been tuned will most likely have different values within their timing tables. Not to worry, for the sake of this tutorial only the column header values really matter.
Before editing any existing maps, make a backup copy of the file, which can be used as a reference to make sure no typos or other errors have crept into the editing process.

Figure 1, stock* 2003 Evolution VIII ECU High Octane Ignition Map
* PLEASE NOTE: This map has been slightly edited to make it easier to illustrate the process of editing the map. Specifically, the timing values in the 260% Load column ranging from 3500 RPM to 5500 RPM have been increased by 1 degree.
...
Figure 1 shows what the stock* High Octane Ignition Map looks like. Cars that have already been tuned will most likely have different values within their timing tables. Not to worry, for the sake of this tutorial only the column header values really matter.
Before editing any existing maps, make a backup copy of the file, which can be used as a reference to make sure no typos or other errors have crept into the editing process.
Figure 1, stock* 2003 Evolution VIII ECU High Octane Ignition Map
* PLEASE NOTE: This map has been slightly edited to make it easier to illustrate the process of editing the map. Specifically, the timing values in the 260% Load column ranging from 3500 RPM to 5500 RPM have been increased by 1 degree.
...
Last edited by Ludikraut; Jul 11, 2006 at 03:13 PM.
Jul 11, 2006, 02:58 PM
#3
Evolved Member
Thread Starter
iTrader: (17)
Join Date: Apr 2004
Location: 41� 59' N, 87� 54' W
Posts: 6,224
Likes: 0
Received 0 Likes
on
0 Posts
2.) Choose which columns will be eliminated
In this tutorial we will be rescaling the Load (%) column values to a maximum value of 300. There are a number of ways in which this could be achieved:
a.) Single column edit
We could simply change the last column from 260 to 300. This will work, but it will leave a rather large range of Load percentage values beyond our immediate control. If we change the last column to 300, then the ECU will have to interpolate any value between the 240 column and the (new) 300 column. Since this is also the arguably most critical range of the maps to tune, we�ll take a different approach
b.) Multiple column edit
We could attempt to mimic the stock scaling in the higher load regions to get us to a maximum value of 300%. This would mean using increments of 20% to get to 300% and would result in a 280% and 300% column. Due to the table size limitations of the ECU (see introduction), this also means that we have to �lose� two columns to make room for the two �new� columns.
Because of the obvious shortcomings of method (a), I chose to rescale the Load percentage values based on method (b). This is also, incidentally, how Mitsubishi chose to rescale the Load percentage values in the Evolution VII Ralliart ECU (figure 2).

Figure 2, 2001 Evolution VII Ralliart ECU High Octane Ignition Map
In keeping with Mitsubishi�s approach I decided to eliminate the 70% and 90% Load columns to make room for the 280% and 300% columns. Whichever columns you end up choosing, you�ll want to choose a set of columns that has a relatively linear relationship to each of its adjacent columns.
...
In this tutorial we will be rescaling the Load (%) column values to a maximum value of 300. There are a number of ways in which this could be achieved:
a.) Single column edit
We could simply change the last column from 260 to 300. This will work, but it will leave a rather large range of Load percentage values beyond our immediate control. If we change the last column to 300, then the ECU will have to interpolate any value between the 240 column and the (new) 300 column. Since this is also the arguably most critical range of the maps to tune, we�ll take a different approach
b.) Multiple column edit
We could attempt to mimic the stock scaling in the higher load regions to get us to a maximum value of 300%. This would mean using increments of 20% to get to 300% and would result in a 280% and 300% column. Due to the table size limitations of the ECU (see introduction), this also means that we have to �lose� two columns to make room for the two �new� columns.
Because of the obvious shortcomings of method (a), I chose to rescale the Load percentage values based on method (b). This is also, incidentally, how Mitsubishi chose to rescale the Load percentage values in the Evolution VII Ralliart ECU (figure 2).
Figure 2, 2001 Evolution VII Ralliart ECU High Octane Ignition Map
In keeping with Mitsubishi�s approach I decided to eliminate the 70% and 90% Load columns to make room for the 280% and 300% columns. Whichever columns you end up choosing, you�ll want to choose a set of columns that has a relatively linear relationship to each of its adjacent columns.
...
Last edited by Ludikraut; Jul 11, 2006 at 03:13 PM.
Jul 11, 2006, 02:59 PM
#4
Evolved Member
Thread Starter
iTrader: (17)
Join Date: Apr 2004
Location: 41� 59' N, 87� 54' W
Posts: 6,224
Likes: 0
Received 0 Likes
on
0 Posts
WARNING: Changing the column header values in the High Octane Map will also change the column header values in the associated Low Octane Map. Therefore when you edit the column headers in the High Octane Ignition Map, you are also changing the column headers in the Low Octane Ignition Map. The same holds true when editing the High Octane Fuel Map. Editing its column header values will also change the column headers in the Low Octane Fuel Map.
3.) Edit the Load (%) column header values
We�ll begin by editing the High Octane Ignition Map. Click on the High Octane Ignition Map 1 to pull up the map.
a.) Modify 70% column header (figure 3)
o The first step will be to change the 70% column header to 80%
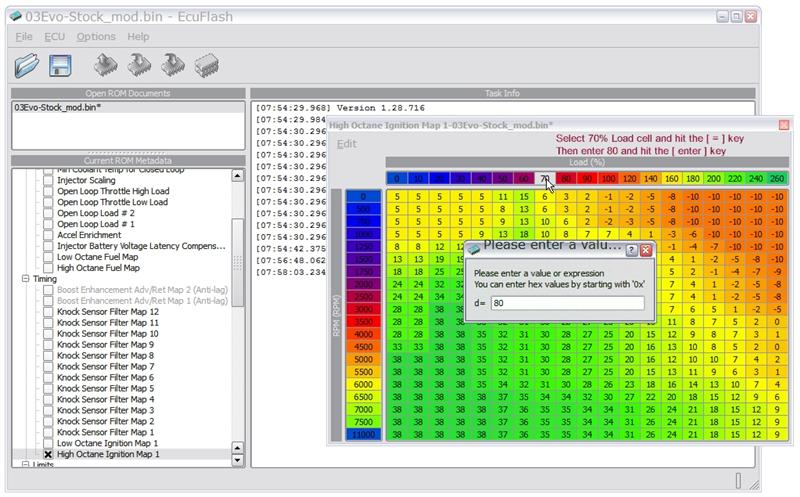
Figure 3, stock* 2003 Evolution VIII ECU High Octane Ignition Map Edit 70% Column

Figure 4, modified 2003 Evolution VIII ECU High Octane Ignition Map, two 80% columns
...
3.) Edit the Load (%) column header values
We�ll begin by editing the High Octane Ignition Map. Click on the High Octane Ignition Map 1 to pull up the map.
a.) Modify 70% column header (figure 3)
o The first step will be to change the 70% column header to 80%
- Click on the 70
- Press the [ = ] key (this will pop-up the �please enter a value� window)
- Type 80 into the pop-up window (next to the d = )
- Press the [ Enter ] key
- The map should now look like the map in figure 4. There should now be 2 columns that have a header value of 80.
Figure 3, stock* 2003 Evolution VIII ECU High Octane Ignition Map Edit 70% Column
Figure 4, modified 2003 Evolution VIII ECU High Octane Ignition Map, two 80% columns
...
Last edited by Ludikraut; Jul 11, 2006 at 04:44 PM.
Jul 11, 2006, 02:59 PM
#5
Evolved Member
Thread Starter
iTrader: (17)
Join Date: Apr 2004
Location: 41� 59' N, 87� 54' W
Posts: 6,224
Likes: 0
Received 0 Likes
on
0 Posts
b.) Move the 100 to 260 column headers 2 cells to the left. (figures 5 to 9)
This will move the existing 100% to 260% load column headers next to the new 80% column.
o Select the 100 to 260 cells (figure 5)
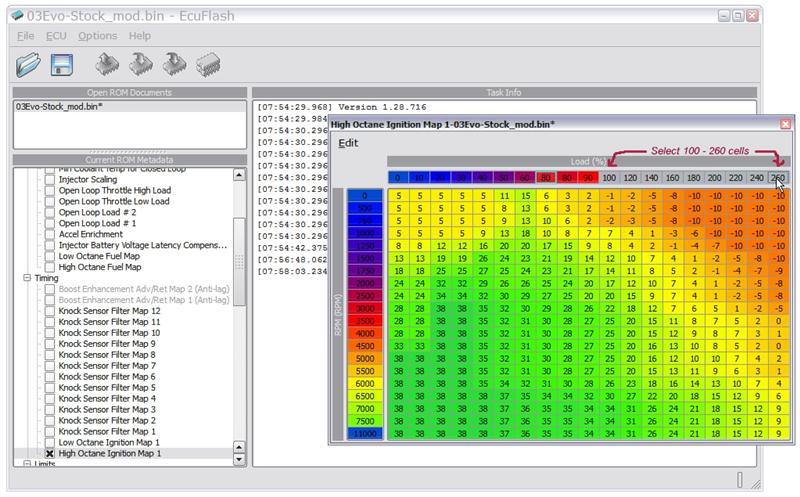
Figure 5, modified 2003 Evolution VIII ECU High Octane Ignition Map, select Load (%) cells
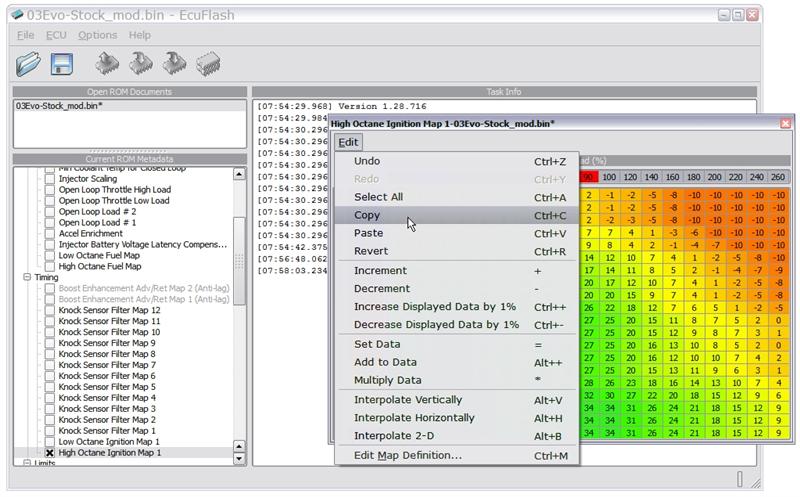
Figure 6, modified 2003 Evolution VIII ECU High Octane Ignition Map, copy cells

Figure 7, modified 2003 Evolution VIII ECU High Octane Ignition Map, select the �second� 80 column header cell

Figure 8, modified 2003 Evolution VIII ECU High Octane Ignition Map, paste
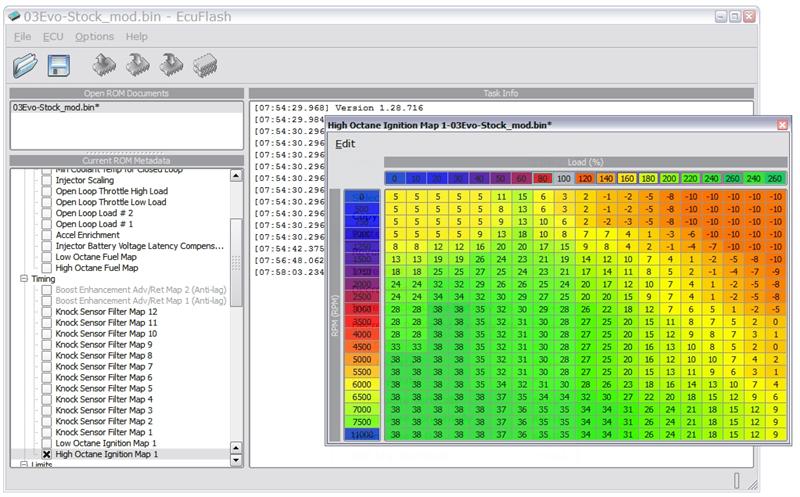
Figure 9, modified 2003 Evolution VIII ECU High Octane Ignition Map, load column headers moved
...
This will move the existing 100% to 260% load column headers next to the new 80% column.
o Select the 100 to 260 cells (figure 5)
- Click on the 100
- While holding the mouse button, drag the cursor over to the 260 cell, which should highlight all of the cells between 100 and 260. As an alternative you can also click on the 100, press the [ Shift ] key and then (while pressing
[ Shift ]) click on 260. This should also highlight all of the cells from 100 to 260.
- Click on the Edit button in the map
- Click on Copy (as an alternative, [ Ctrl ] + [ c ] will also work)
- Highlight the �right� 80 (figure 7)
- Click on the Edit button in the map (figure 8)
- Click on Paste (as an alternative, [ Ctrl ] + [ v ] will also work)
Figure 5, modified 2003 Evolution VIII ECU High Octane Ignition Map, select Load (%) cells
Figure 6, modified 2003 Evolution VIII ECU High Octane Ignition Map, copy cells
Figure 7, modified 2003 Evolution VIII ECU High Octane Ignition Map, select the �second� 80 column header cell
Figure 8, modified 2003 Evolution VIII ECU High Octane Ignition Map, paste
Figure 9, modified 2003 Evolution VIII ECU High Octane Ignition Map, load column headers moved
...
Last edited by Ludikraut; Jul 11, 2006 at 04:45 PM.
Jul 11, 2006, 03:00 PM
#6
Evolved Member
Thread Starter
iTrader: (17)
Join Date: Apr 2004
Location: 41� 59' N, 87� 54' W
Posts: 6,224
Likes: 0
Received 0 Likes
on
0 Posts
c.) Add the 280 and 300 column headers (Figure 10)
Using the same method as in step (3a), edit the last two column headers
The map should now have Load percentage values as shown in figure 10.
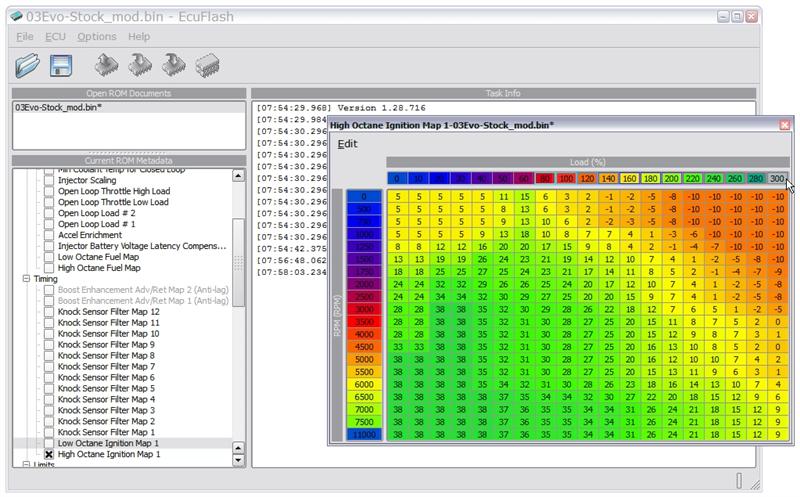
Figure 10, modified 2003 Evolution VIII ECU High Octane Ignition Map, Load Axis modified but timing values still unchanged
...
Using the same method as in step (3a), edit the last two column headers
- Click on the right-most 240 header cell (second from right)
- Press the [ = ] key (this will pop-up the �please enter a value� window)
- Type 280 into the pop-up window (next to the d = )
- Press the [ Enter ] key
- Click on the right-most 260 header cell (last cell on right)
- Press the [ = ] key (this will pop-up the �please enter a value� window)
- Type 300 into the pop-up window (next to the d = )
- Press the [ Enter ] key
The map should now have Load percentage values as shown in figure 10.
Figure 10, modified 2003 Evolution VIII ECU High Octane Ignition Map, Load Axis modified but timing values still unchanged
...
Last edited by Ludikraut; Jul 11, 2006 at 03:30 PM.
Jul 11, 2006, 03:01 PM
#7
Evolved Member
Thread Starter
iTrader: (17)
Join Date: Apr 2004
Location: 41� 59' N, 87� 54' W
Posts: 6,224
Likes: 0
Received 0 Likes
on
0 Posts
d.) Pause and take note of the high and low octane map headers (figure 11)
Now that the column header has been edited for the High Octane map, let�s take a look at what happened to the associated Low Octane map (figure 11).
The column headers have also been changed for the Low Octane map! This only holds true for the header values of the table (both columns and rows), since both the high octane and its low octane counterpart reference the same Load (%) and RPM scale.
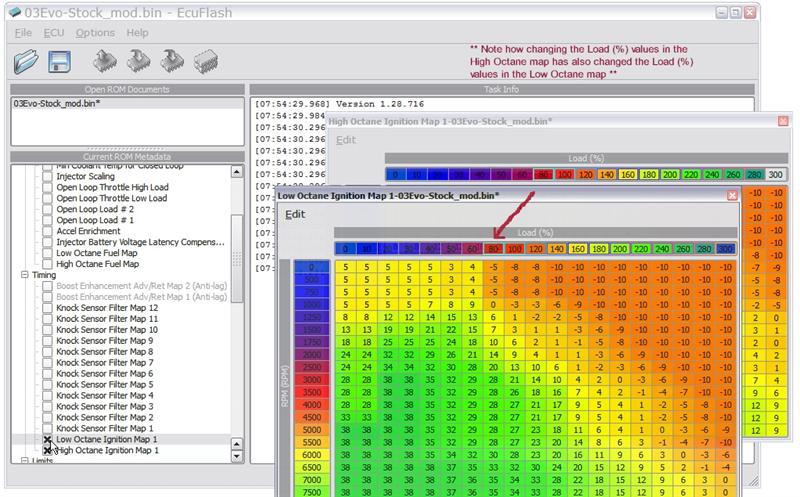
Figure 11, modified 2003 Evolution VIII ECU High and Low Octane Ignition Maps,
...
Now that the column header has been edited for the High Octane map, let�s take a look at what happened to the associated Low Octane map (figure 11).
The column headers have also been changed for the Low Octane map! This only holds true for the header values of the table (both columns and rows), since both the high octane and its low octane counterpart reference the same Load (%) and RPM scale.
Figure 11, modified 2003 Evolution VIII ECU High and Low Octane Ignition Maps,
...
Last edited by Ludikraut; Jul 11, 2006 at 04:06 PM.
Trending Topics
Jul 11, 2006, 03:02 PM
#8
Evolved Member
Thread Starter
iTrader: (17)
Join Date: Apr 2004
Location: 41� 59' N, 87� 54' W
Posts: 6,224
Likes: 0
Received 0 Likes
on
0 Posts
4.) Move the old column values within the map to their new locations
Now that the column headers have been changed to reflect the new Load (%) scale, all of the columns need to be moved back under the correct Load (%) column. The table as it sits right now (figure 10) has the values for the 80% column sitting under the 100% header and the 100% to 260% columns are sitting under the 140% to 300% headers.
a.) Copy and paste the current 100% Load column into the 80% Load column
This will move the 80% Load timing values back under the 80% column
o Select all of the values in the 100% Load column.

Figure 12, modified 2003 Evolution VIII ECU High Octane Ignition Map, copy 100% column

Figure 13, modified 2003 Evolution VIII ECU High Octane Ignition Map, paste 80% column
b.) Copy and paste the current 140% to 300% Load columns into the 100% to 260% columns
This will move the remaining timing values back into the correct columns
o Select all of the values ranging from the 140% Load column to the 300% Load column
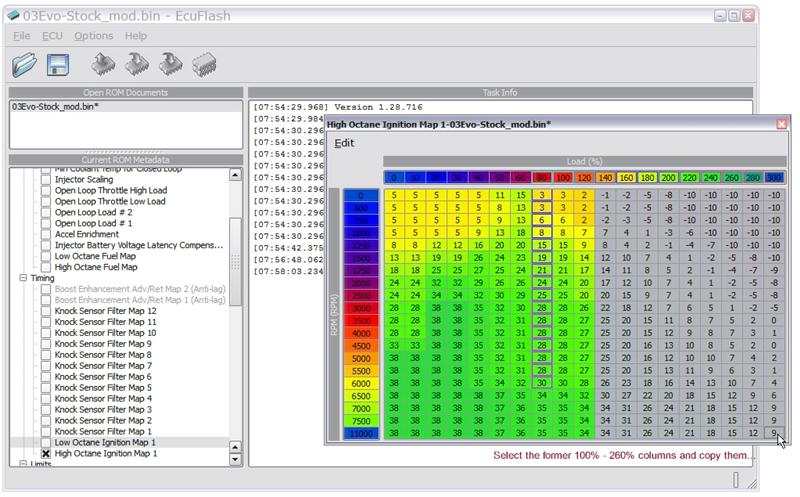
Figure 14, modified 2003 Evolution VIII ECU High Octane Ignition Map, select 140% to 300% columns and copy
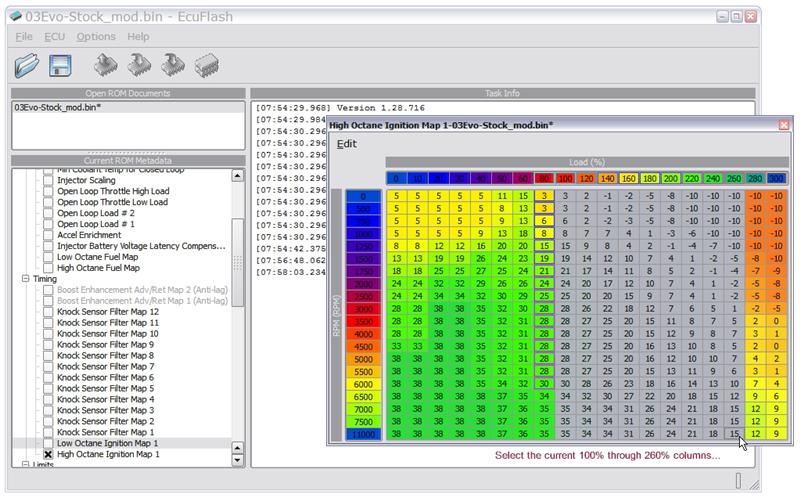
Figure 15, modified 2003 Evolution VIII ECU High Octane Ignition Map, select 100% to 260% columns

Figure 16, modified 2003 Evolution VIII ECU High Octane Ignition Map, paste into 100% to 260% columns
...
Now that the column headers have been changed to reflect the new Load (%) scale, all of the columns need to be moved back under the correct Load (%) column. The table as it sits right now (figure 10) has the values for the 80% column sitting under the 100% header and the 100% to 260% columns are sitting under the 140% to 300% headers.
a.) Copy and paste the current 100% Load column into the 80% Load column
This will move the 80% Load timing values back under the 80% column
o Select all of the values in the 100% Load column.
- Click on the first value (0 RPM row) in the 100% column and, while holding the mouse button, drag the cursor down to the last value in the 100% column. Alternately you can also click on the first value (0 RPM row) in the 100% column, press and hold the [ Shift ] key and then click on the last value in the 100% column.
- The 100% column should now be highlighted as shown in figure 12.
- Click on the Edit button in the map
- Click on Copy (as an alternative, [ Ctrl ] + [ c ] will also work)
- Select all of the values in the 80% Load column
- Click on the Edit button in the map
- Click on Paste (as an alternative, [ Ctrl ] + [ v ] will also work)
Figure 12, modified 2003 Evolution VIII ECU High Octane Ignition Map, copy 100% column
Figure 13, modified 2003 Evolution VIII ECU High Octane Ignition Map, paste 80% column
b.) Copy and paste the current 140% to 300% Load columns into the 100% to 260% columns
This will move the remaining timing values back into the correct columns
o Select all of the values ranging from the 140% Load column to the 300% Load column
- Click on the top cell (0 RPM row) in the 140% column and, while holding the mouse button, drag the cursor down to the last value in the 300% column. Alternately you can also click on the first value (0 RPM row) in the 140% column, press and hold the [ Shift ] key and then click on the last value in the 300% column.
- The 140% to 300% columns should now be selected as shown in figure 14.
- Click on the Edit button in the map
- Click on Copy (as an alternative, [ Ctrl ] + [ c ] will also work)
- The 100% to 260% columns should now be selected as shown in figure 14.
- Select all of the values in the 100% to 260% columns
- Click on the Edit button in the map
- Click on Paste (as an alternative, [ Ctrl ] + [ v ] will also work)
Figure 14, modified 2003 Evolution VIII ECU High Octane Ignition Map, select 140% to 300% columns and copy
Figure 15, modified 2003 Evolution VIII ECU High Octane Ignition Map, select 100% to 260% columns
Figure 16, modified 2003 Evolution VIII ECU High Octane Ignition Map, paste into 100% to 260% columns
...
Last edited by Ludikraut; Jul 11, 2006 at 03:51 PM.
Jul 11, 2006, 03:03 PM
#9
Evolved Member
Thread Starter
iTrader: (17)
Join Date: Apr 2004
Location: 41� 59' N, 87� 54' W
Posts: 6,224
Likes: 0
Received 0 Likes
on
0 Posts
5.) Rescale the values contained in the new high load cells
Now that all of the original map values are back in the correct load columns, we need to turn our attention to the two new high load columns, the 280% and 300% load columns. Since these columns are currently populated with data from the 240% and 260% load columns, they will have to be rescaled to accurately reflect the higher loads which are being addressed.
a.) Copy and paste the current 300% Load column into the 280% Load column
This will set the map values of the 260-300% columns to be the same.
o Select all of the values in the 300% Load column
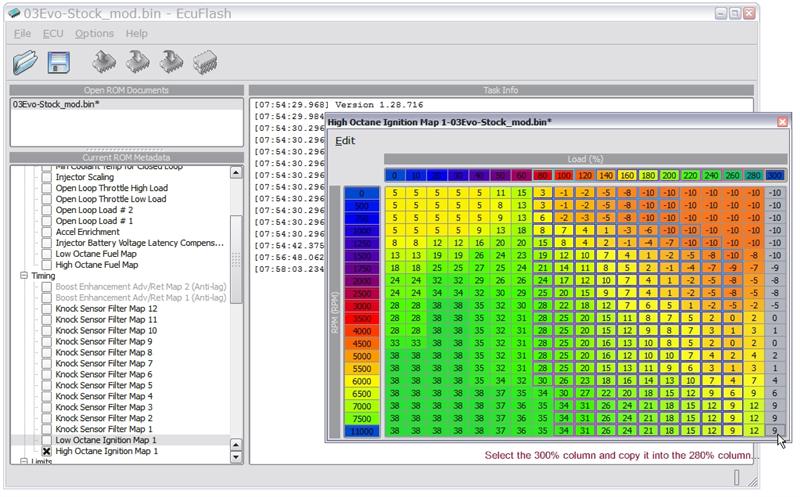
Figure 17, modified 2003 Evolution VIII ECU High Octane Ignition Map, select 300% Load column and copy
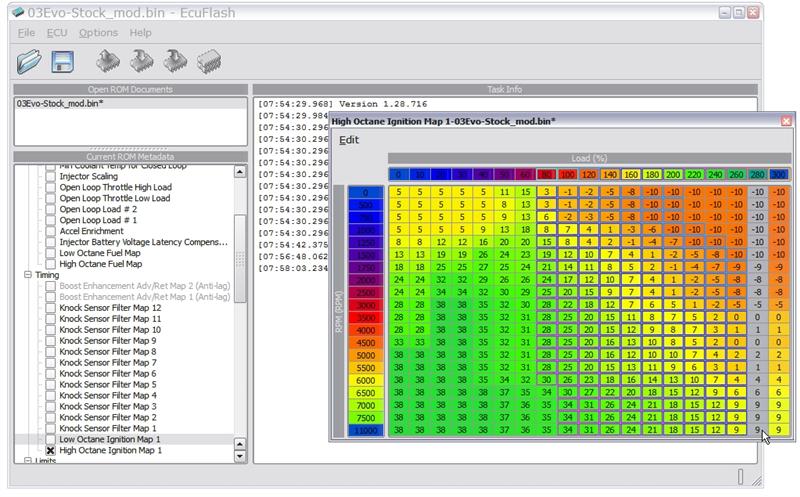
Figure 18, modified 2003 Evolution VIII ECU High Octane Ignition Map, paste into 280% Load column
b.) Adjust (timing/fuel) values in the new high load columns
Note how pasting the same the values into the new load columns has resulted in a large, flat area in the ECU table (figure 20), very much in contrast to how the stock ECU table is configured as shown in the figure 19 comparison. Since we do not know yet if the car can handle the same timing or fuel values in the higher load cells, it is prudent to reduce the values in each of the new columns to mimic the offsets already established by adjacent columns.

Figure 19, stock versus modified, but still flat timing values 2003 Evolution VIII ECU High Octane Ignition Map
Changing the values in the new load columns will also allow us to determine if the car is actually hitting the new load cells.
For example, taking the 5000 RPM load cells, the timing values in the 220 to 260 Load columns are: 7, 4, 2. This gives us timing offsets of -3 and -2 degrees between each cell. In my rescaling I chose to carry forward an offset of -2 followed by -1, which results in a row of values as follows:
@5000 RPM:
220% ... 7
240% ... 4
260% ... 2
280% ... 0
300% ... -1
Take a look at the table in figure 21 for the complete set of timing values that I chose for the new columns.
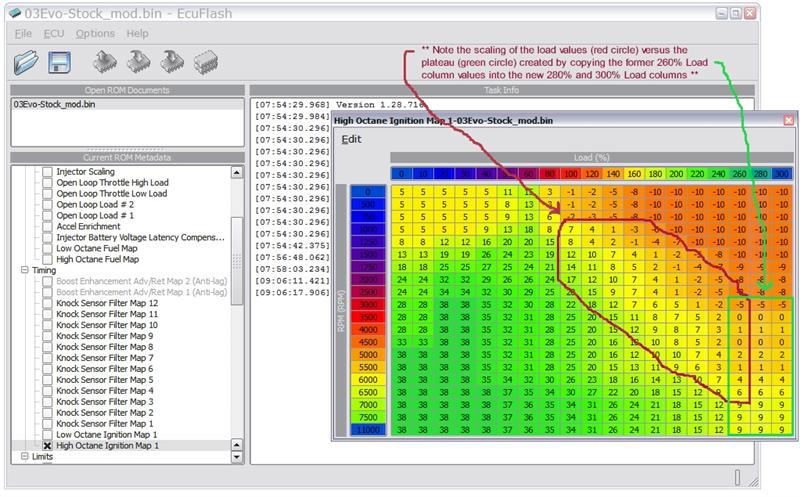
Figure 20, modified 2003 Evolution VIII ECU High Octane Ignition Map, timing plateau versus factory curve

Figure 21, modified 2003 Evolution VIII ECU High Octane Ignition Map, rescaled to eliminate timing �plateau�
Finally (because I just had to add one more cool graph) here is the comparison of the stock timing map to the new redefined and rescaled timing map (figure 22).

Figure 22, stock versus modified, with rescaled timing values 2003 Evolution VIII ECU High Octane Ignition Map
...
Now that all of the original map values are back in the correct load columns, we need to turn our attention to the two new high load columns, the 280% and 300% load columns. Since these columns are currently populated with data from the 240% and 260% load columns, they will have to be rescaled to accurately reflect the higher loads which are being addressed.
a.) Copy and paste the current 300% Load column into the 280% Load column
This will set the map values of the 260-300% columns to be the same.
o Select all of the values in the 300% Load column
- Click on the first value (0 RPM row) in the 300% column and, while holding the mouse button, drag the cursor down to the last value in the 300% column. Alternately you can also click on the first value (0 RPM row) in the 300% column, press and hold the [ Shift ] key and then click on the last value in the 300% column.
- The 300% column should now be highlighted as shown in figure 17.
- Click on the Edit button in the map
- Click on Copy (as an alternative, [ Ctrl ] + [ c ] will also work)
- Select all of the values in the 280% Load column
- Click on the Edit button in the map
- Click on Paste (as an alternative, [ Ctrl ] + [ v ] will also work)
Figure 17, modified 2003 Evolution VIII ECU High Octane Ignition Map, select 300% Load column and copy
Figure 18, modified 2003 Evolution VIII ECU High Octane Ignition Map, paste into 280% Load column
b.) Adjust (timing/fuel) values in the new high load columns
Note how pasting the same the values into the new load columns has resulted in a large, flat area in the ECU table (figure 20), very much in contrast to how the stock ECU table is configured as shown in the figure 19 comparison. Since we do not know yet if the car can handle the same timing or fuel values in the higher load cells, it is prudent to reduce the values in each of the new columns to mimic the offsets already established by adjacent columns.
Figure 19, stock versus modified, but still flat timing values 2003 Evolution VIII ECU High Octane Ignition Map
Changing the values in the new load columns will also allow us to determine if the car is actually hitting the new load cells.
- Edit the 280% column values and 300% column values to approximate the timing curve carried forward from the 220%, 240% and 260% column in each respective row.
For example, taking the 5000 RPM load cells, the timing values in the 220 to 260 Load columns are: 7, 4, 2. This gives us timing offsets of -3 and -2 degrees between each cell. In my rescaling I chose to carry forward an offset of -2 followed by -1, which results in a row of values as follows:
@5000 RPM:
220% ... 7
240% ... 4
260% ... 2
280% ... 0
300% ... -1
Take a look at the table in figure 21 for the complete set of timing values that I chose for the new columns.
Figure 20, modified 2003 Evolution VIII ECU High Octane Ignition Map, timing plateau versus factory curve
Figure 21, modified 2003 Evolution VIII ECU High Octane Ignition Map, rescaled to eliminate timing �plateau�
Finally (because I just had to add one more cool graph) here is the comparison of the stock timing map to the new redefined and rescaled timing map (figure 22).
Figure 22, stock versus modified, with rescaled timing values 2003 Evolution VIII ECU High Octane Ignition Map
...
Last edited by Ludikraut; Jul 11, 2006 at 04:24 PM.
Jul 11, 2006, 03:04 PM
#10
Evolved Member
Thread Starter
iTrader: (17)
Join Date: Apr 2004
Location: 41� 59' N, 87� 54' W
Posts: 6,224
Likes: 0
Received 0 Likes
on
0 Posts
6.) Repeat steps 4 and 5 for the Low Octane Timing Map
Remember that by changing the Load (%) column header values in the High Octane Timing Map, we have also changed the Load (%) column header values for the Low Octane Timing Map.
Follow the instructions in steps (4) and (5), with Figure 23 and 24 as a guide. The current Low Octane Timing Map should look like the map in Figure 23. The data of the former 80% column and the former 100-260% columns need to be moved back under their correct header values (step 4), then the timing values in the 280% and 300% load columns need to be adjusted (step 5). The final Low Octane Timing Map should look like the map shown in Figure 24.
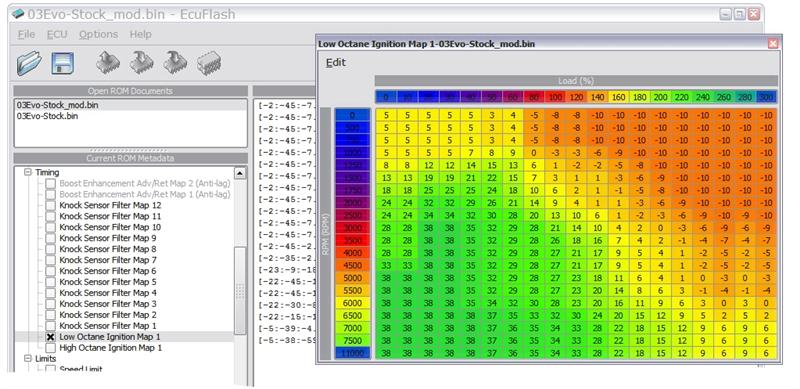
Figure 23, modified 2003 Evolution VIII ECU Low Octane Ignition Map, new Load (%) scale but still with stock timing values
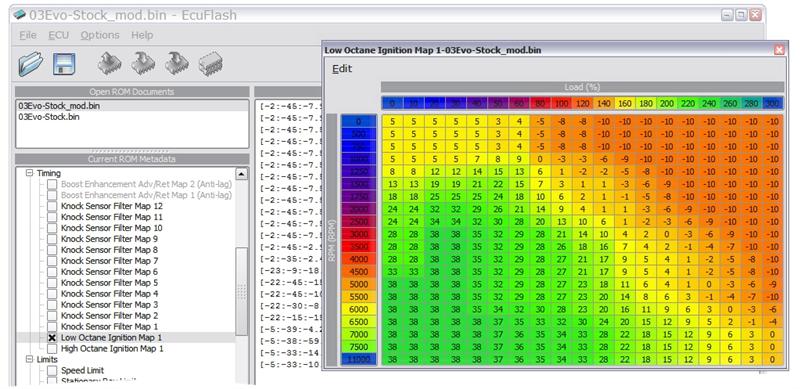
Figure 24, modified 2003 Evolution VIII ECU Low Octane Ignition Map, timing values moved and rescaled
...
Remember that by changing the Load (%) column header values in the High Octane Timing Map, we have also changed the Load (%) column header values for the Low Octane Timing Map.
Follow the instructions in steps (4) and (5), with Figure 23 and 24 as a guide. The current Low Octane Timing Map should look like the map in Figure 23. The data of the former 80% column and the former 100-260% columns need to be moved back under their correct header values (step 4), then the timing values in the 280% and 300% load columns need to be adjusted (step 5). The final Low Octane Timing Map should look like the map shown in Figure 24.
Figure 23, modified 2003 Evolution VIII ECU Low Octane Ignition Map, new Load (%) scale but still with stock timing values
Figure 24, modified 2003 Evolution VIII ECU Low Octane Ignition Map, timing values moved and rescaled
...
Last edited by Ludikraut; Jul 11, 2006 at 04:18 PM.
Jul 11, 2006, 03:05 PM
#11
Evolved Member
Thread Starter
iTrader: (17)
Join Date: Apr 2004
Location: 41� 59' N, 87� 54' W
Posts: 6,224
Likes: 0
Received 0 Likes
on
0 Posts
7.) Repeat steps 2 through 6 for the High and Low Octane Fuel Maps
Follow the instructions in steps (2), (3), (4), and (5), with Figures 25, 26, and 27 as a guide. Just as with the timing maps, the column headers need to be redefined (step 2, step 3), then the values in the table need to be moved back under their respective column headers (step 4), and finally the values in the two new high load columns have to be rescaled (step 5).
Figures 25 and 26 illustrate what the High and Low Octane Fuel Maps should look like before and after the Load (%) values have been changed as part of steps (2) and (3).
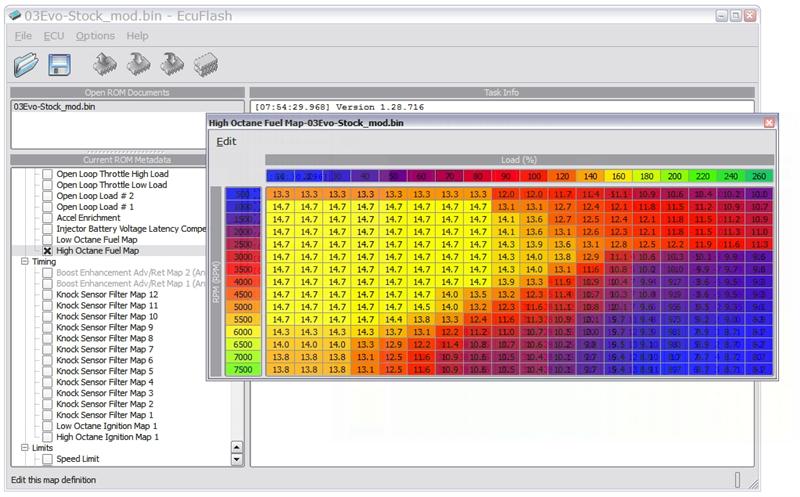
Figure 25, stock 2003 Evolution VIII ECU High Octane Fuel Map
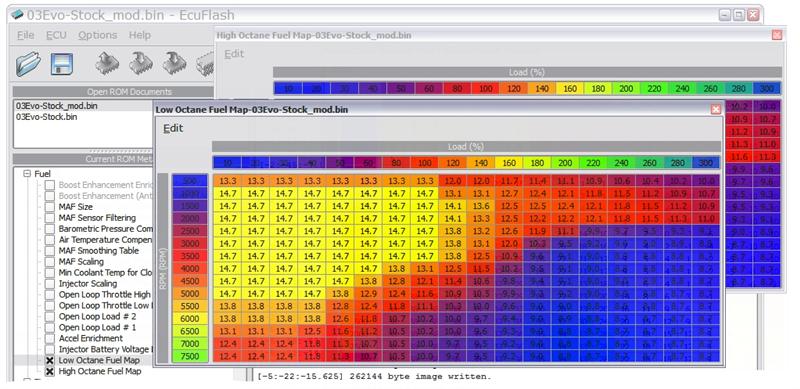
Figure 26, modified 2003 Evolution VIII ECU High and Low Octane Fuel Map, Load (%) values before adjusting fuel targets within map
Figure 27 illustrates how I chose to rescale the 280% and 300% columns in the High Octance Fuel Map. Don�t forget to move the previous 80% and 100%-260% columns back under their respective headers (step 4), before rescaling the fuel target values in the 280% and 300% column (step 5).
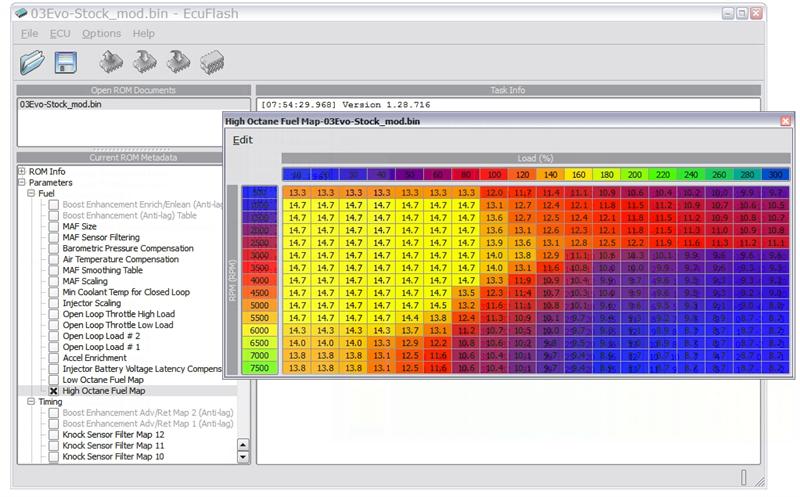
Figure 27, modified 2003 Evolution VIII ECU High Octane Fuel Map
...
Follow the instructions in steps (2), (3), (4), and (5), with Figures 25, 26, and 27 as a guide. Just as with the timing maps, the column headers need to be redefined (step 2, step 3), then the values in the table need to be moved back under their respective column headers (step 4), and finally the values in the two new high load columns have to be rescaled (step 5).
Figures 25 and 26 illustrate what the High and Low Octane Fuel Maps should look like before and after the Load (%) values have been changed as part of steps (2) and (3).
Figure 25, stock 2003 Evolution VIII ECU High Octane Fuel Map
Figure 26, modified 2003 Evolution VIII ECU High and Low Octane Fuel Map, Load (%) values before adjusting fuel targets within map
Figure 27 illustrates how I chose to rescale the 280% and 300% columns in the High Octance Fuel Map. Don�t forget to move the previous 80% and 100%-260% columns back under their respective headers (step 4), before rescaling the fuel target values in the 280% and 300% column (step 5).
Figure 27, modified 2003 Evolution VIII ECU High Octane Fuel Map
...
Last edited by Ludikraut; Jul 11, 2006 at 04:23 PM.
Jul 11, 2006, 03:05 PM
#12
Evolved Member
Thread Starter
iTrader: (17)
Join Date: Apr 2004
Location: 41� 59' N, 87� 54' W
Posts: 6,224
Likes: 0
Received 0 Likes
on
0 Posts
Conclusion
Hopefully this tutorial proved helpful. Be sure to double check your work before you upload any edited maps to your vehicle.
See you at the track�
l8r)
Hopefully this tutorial proved helpful. Be sure to double check your work before you upload any edited maps to your vehicle.
See you at the track�
l8r)

